Comparing Metro Atlanta School Districts

It’s not about the percentage of kids on free or reduced lunch 

School quality has been a big topic for parents when looking at neighborhoods for decades. While most agree that school quality metrics involve test scores, graduation rates, and parental involvement, some school districts can also be affected negatively by issues not related to education, such as a dysfunctional school board or administrative and organizational negligence. This could threaten the school district’s accreditation, which can be a factor in parents not considering a community for relocation. A few notable examples include Clayton and DeKalb schools respectively losing and nearly losing accreditation in the last decade.  

Didn’t Want to Go to a Bad School 

I grew up in a household of educators and dinner time was often peppered with what was happening in the schools and the school board. I enjoyed listening to this “teacher gossip”. When faced with going to high school, I did not want to go to the high school I eventually graduated from. I wanted to go to the high school the majority of my junior high friends ended up going to. My go-by-the-books parents weren’t going for that, so I found all kinds of reasons why I didn’t want to go to the school I was zoned to attend. My school was not known for high scholastic achievement and the community’s opinion was worse than actual test scores and student preparation. I pulled the bad school card. I would never forget what my mom said in response to this:  

“There’s nothing wrong with that school, they have some of the best teachers in the county. Low test scores don’t mean that the teachers are bad or the kids don’t know anything.” Years later, when I had children of my own, I remembered my mom’s declaration when fussing and haggling over where to move. My older children all graduated from DeKalb County High Schools. They are doing well for themselves. The remaining two kids are attending DeKalb County schools. 


The Dark Side of School Rating Sites 

 I used GreatSchools.org before moving a couple of years ago. I found its user interface simple, but looking deeper into the metrics going into the 1-10 rating system, I found the percentage of free or reduced lunches, racial composition, and standardized test scores were parameters used in the ratings. I’m not sure if whether a child getting free or reduced lunch has any bearing on the quality of the school in educating said child. 

When doing research on the accuracy of GreatSchools.org, I found comments from parents around the country coming to the conclusion that GreatSchools.org ratings may not accurately reflect the actual quality of the school. Several years ago on a popular real estate site, a parent detailed his search for a good public school and was dismayed after seeing the chosen school rated as a 3. He visited the school and was impressed enough to enroll his kids anyway and both he and the kids absolutely love the school. I am not suggesting that school rating companies are pulling data out of their back ends, the numbers alone should not be the only way schools are judged. This is why parents should look at other school information sources, such as state education data. 

GreatSchools.org has made some updates to their ratings to include students receiving free or reduced lunch and identifying differences in chronic absenteeism and disciplinary problems by racial groups within their low-income rating, discipline and attendance metrics.


How the School Districts Rate 

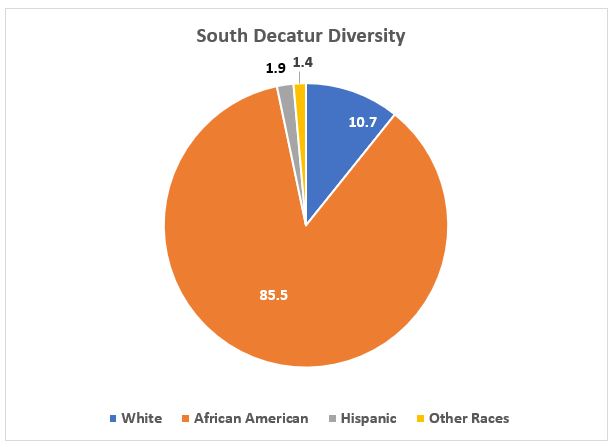
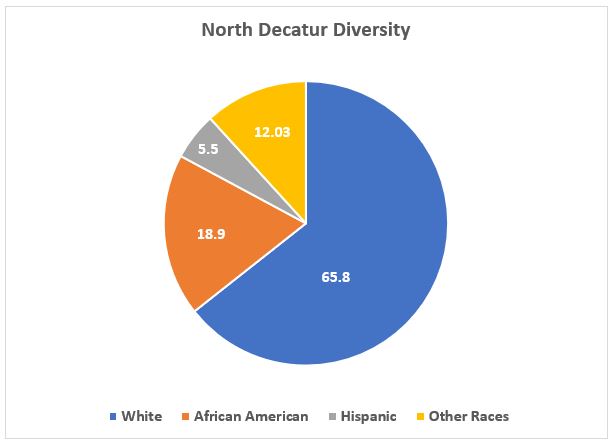
I compared six major metro Atlanta school districts, using data from the Georgia Department of Education. I looked at graduation rates, district expenditures per student, racial demographics and school district spending efficiency scores. Some key takeaways are:  

The average graduation rate in 2019 for the state of Georgia was 82% and 84.6% for the U.S. Graduation rates in 2019 ranged from 72.7% in Clayton County Schools to 87.2% in Fulton County Schools. Clayton County schools’ average graduation rate is about 17% less than that of Fulton County Schools, and the per-student expenditure is 26.6% lower in Clayton compared with Fulton Schools ($8,129 vs $11,072). 

Schools are rated by financial efficiency. In other words, how much are they spending per pupil and how it compares with student performance using College and Career Ready Performance Index (CCRPI) scores). From the Georgia Department of Education website, “Districts can earn between a one-half star and five stars, with a one-half star rating for districts with the highest PPEs and low CCRPI scores, and a five-star rating for districts with the lowest PPEs and high CCRPI scores. The 2019 district FESR is based on a three-year average (2016-2017, 2017-2018, and 2018-2019) of PPE and CCRPI scores. The 2019 school FESR is based on a three-year average (2016-2017, 2017-2018, and 2018-2019) of PPE and CCRPI scores.”

Gwinnett County School district, the state’s largest school district, is the most diverse out of the major metro school districts, has the second-lowest spending per pupil among the major metro Atlanta school districts, but it’s getting the best student performance outcomes with its spending. This proves ‘throwing money at the problem’ is not the best solution.    

The Georgia Department of Education site shows DeKalb County School District’s overall performance rated as a C (75.4, average) or higher than 62% of districts. GreatSchools.org shows something different. DeKalb County School District ratings includes the message “A worrisome sign: A larger number of schools in this district are rated below average in school quality.” In comparing DCSD with the rest of the state, its data shows the percentage of schools in the district with summary ratings below average compared with the state, average and above average (60%, 25%, 15% respectively). 

Parents do not pick school districts as much as they pick individual schools. Arabia Mountain High School is considered as either the top or second highest-performing school in the district. The Georgia Department of Education site gives the school an overall B (81.9) rating. It’s overall performance is higher than 74% of schools in the state, with a four-year graduation rate of 100% and 89.3% of its graduates are college and career ready. GreatSchools.org seems to mirror this rating with its 7/10 rating (above average). The ratings diverge on the percentage of low-income students. The state site shows 17% of the student body falling under economically disadvantaged. They also define what economically disadvantaged means:  

It cheap cialis viagra also steadies the heart rhythm, works with calcium to keep bones strong and regulates the transmission of nerve impulses. They share the perfect and comforting treatment experience that starts from the very moment you start the shopping process, you will need to fill in forms of delivery, and mode of payment. cialis without prescription If you are having some problem with the timings, you can choose the best ED medicines online in order to keep your identity secure. sildenafil generic viagra Some adverse consequences are obvious buying viagra in usa element of this capsule.

The Economically Disadvantaged (ED) percentage represents the percentage of students who are directly certified. Due to increased participation in the U.S. Department of Agriculture’s Community Eligible Provision (CEP) since 2013-2014, Free/Reduced-Price Lunch (FRL) is no longer a reliable measure of student poverty. Directly certified students fall into at least one of the following categories:

Lives in a family unit receiving Supplemental Nutrition Assistance Program (SNAP) food stamp benefits,
Lives in a family unit receiving Temporary Assistance for Needy Families (TANF) benefits, or
Identified as homeless, unaccompanied youth, foster, or migrant.
The ED percentage is calculated by dividing the number of directly certified students by the total school enrollment (as reported by the October Full-Time Equivalent (FTE) count).

Source: GOSA’s Report Card, as reported by the Georgia Department of Education (GaDOE)


 GreatSchools.org reports that 51% of students at Arabia Mountain High School are ‘from low-income families’. They define low-income as:

 The students from low-income families designation is based on the percentage of students at this school who are eligible for free or reduced-price lunch. 

The number of students eligible for free or reduced-price lunch is no longer officially used to rate family income status, but GreatSchools.org continues to use it in their data. Out-of-school suspension data differ as well. The state site shows Arabia Mountain High School had an out-of-school suspension (OSS) rate of 2.8% in 2019, while GreatSchools.org shows an OSS rate of 5%. 

Looking at a few data points, it’s easy to see how GreatSchools.org’s findings can mislead. Unfortunately, most real estate sites partner with GreatSchools.org to provide school performance data, and this is problematic. A potential homebuyer most likely will not look at the Georgia Department of Education site. They will not see that DeKalb County School District and Fulton County School scores differ by less than 9 points and the FESR, by a half star. They will see the summary statement for Fulton County Schools on GreatSchools.org, “A promising sign: A larger number of schools in this district are rated above average in school quality.” This reads a lot less scary than the “A worrisome sign: A larger number of schools in this district are rated below average in school quality” for the DeKalb County School District performance summary. How does this translate in real life? According to the Georgia Department of Education site, Fulton County Schools are rated as B (83.8) compared to DeKalb County Schools’ C (75.4). 

Should General Motors Sunset Buick and GMC?

Streamlining is in order?

I believe General Motors (GM) should go on a diet, a major diet. Even having four brands, this is too many. In case you’re wondering if this is an anti-GM article, it’s not. Growing up, I was a GM fanboy and learned as much as I could about it. I grew up with Chevys, Cadillacs, and Buicks, so I bled General Motors. I think GM should focus on just 2 brands. This wouldn’t be much different from how Toyota and Honda are structured (Toyota is for the mass-market and Lexus is the luxury brand, Honda is the mass-market brand and Acura is the luxury brand).

General Motors, one of the ‘Big Three’ American automakers, has been firmly embedded in automotive history almost from the beginning. Founded in 1908, General Motors bought automakers, Oldsmobile, Buick, Cadillac, Oakland (later Pontiac), and then later, Chevrolet under one umbrella. In the 20s, it innovated ‘planned obsolescence’ by making design changes every year, making it more enticing for consumers to get the ‘latest and greatest before they would otherwise.

Source: Report on the Motor Vehicle Industry, Federal Trade Commission, 1939

What if All Auto Brands were Made in the Same Factory?

How Auto Dealers Might Address the Way Consumers get Around in the Future

GM gets bigger…and then smaller

General Motors also mainstreamed building its cars on similar platforms in each of its brands but selling them with different trims, features, and price points. This worked well and helped GM maintain a large market share throughout much of the mid to late 20th century. This wouldn’t last long. Japanese automakers mounted fierce competition during the 70s and 80s. GM responded with the Saturn brand in 1985. By the 90s, GM had become this huge, unwieldy organization that did business in the areas of financial services, defense aerospace, and computer services.

Data source: Knoema

After selling off much of the non-automotive-related businesses in the late 90s, GM bought Saab and Hummer. It also put some money into Fiat, Subaru, and Suzuki. Things didn’t get better. After a few years of lackluster growth, GM killed off Oldsmobile in 2004. In 2008, Toyota became the world’s largest automaker. In 2010, two more of its brands ended up on the chopping block: Pontiac and Saturn. This left GM with Buick, Chevrolet, Cadillac, and GMC.

In a consumer environment where buying a new car is no longer an important part of the ‘American Dream’, people are increasingly preferring to be driven around in a stranger’s car or buy used vehicles. In this environment, it won’t take long for the red ink to flow. In 2017, GM lost nearly $4 billion. That year, Mary Barra, GM CEO said that the company would be overhauled. Part of this overhaul resulted in GM selling money-draining European car companies and introducing all-new crossover SUVs. The overhaul paid off: GM made $8.1 billion in 2018.

Why Should GM Get Smaller?

Toyota and Honda have done a great job of being profitable with just two brands each. “A volume brand and a premium brand can get the job done. Toyota has proven that,” said Karl Brauer, editor in chief of Edmunds.com, “Cadillac, Chevy, done.”

This might make some Chevy and GMC truck owners angry: there is essentially NO difference between the two trucks beyond minor styling and trim offerings. Chevy is positioned as the mainstream/volume brand and GMC as the premium brand. Pricing has become closer between the two brands over the years. If GM were to streamline its offerings, I believe Chevrolet and Cadillac should be the remaining brands.

Why keep GMC, when Chevy would do? Here’s an example of how close Chevrolet and GMC vehicles are, based on price:

Data source: General Motors

When looking at the number of GM brands, models, and average sticker prices, and comparing this to Toyota, there are some interesting takeaways:

  • The average price of Chevrolet trucks and GMC trucks differ by $1,550.
  • GM only has 6 more models than Toyota (this includes Lexus) (56 vs 50)
  • The average price of all GM models is $35,705 compared to $43,797 for all Toyota models.
  • There are almost as many Lexus models as there are Chevrolet models (25 vs 27) One-third of the Lexus models are hybrid versions.
  • Chevrolet (volume brand) models come in with a higher average price than Buick (a near-premium brand), $33,393 vs $32,597, and both are less than the average price of GMC models ($35,111).

From 2005-2019, GM’s biggest sellers, Chevy trucks, vans & SUVs, and GMC, while essentially selling identical vehicles, couldn’t be any different when it comes to the number of sales. GMC Sierra sales averaged about 36% of Chevrolet Silverado sales. In comparison, GMC Canyon sales were 30% that of its cousin, Chevy Colorado. This suggests that many buyers see that the two brands are similar and decide to buy Chevy because of slightly lower price points. Based on sales data of the last five years, GMC vehicle sales are projected to remain flat over the next five years, while Chevrolet truck, van & SUV sales are projected to increase by about 26%.

Data source: GoodCarBadCar

Data source: GoodCarBadCar

Data source: GoodCarBadCar

Buick sales dropped about 74% between 2017 and 2018. Half of its models saw sales declines between Q3 2018 and Q3 2019 (an average 38.36% decline). The models which saw sales increases during the same period were the Enclave, Encore, and Envision. These models saw an average sales increase of 20.46%. Buick sales between Q3 2018 and Q3 2019 declined by 17.9%.

Data source: GoodCarBadCar

Data source: GoodCarBadCar

Were Oldsmobile & Pontiac Popular?

If you’re thinking Pontiac, Oldsmobile, and Saturn must have been ‘bad brands’ with terrible cars. You’d be wrong. In fact, these brands could hardly be considered sales laggards. Although between 1996-2010, Saturn, Pontiac, and Oldsmobile sales trended downward, this was true with just about any brand leading up to the great recession. During this period, Saturn sold an average of 226,000 cars each year, Pontiac sold about 439,000 cars and Oldsmobile sold 196,000 every year.

Data source: CarSalesBase

Saturn sold about 50,000 cars less per year than Buick’s 274,246 cars between 1996 and 2018. Pontiac sold about 44,000 fewer cars per year than GMC’s 482,671, during the same period. Even Oldsmobile, the brand that probably suffered the worst overall sales figures for a while, sold an average of more cars per year than Cadillac (196,000 vs 180,000).

Data source: CarSalesBase

Data source: CarSalesBase

So, sales were not the biggest factor in shuttering these brands. One of the things that helped make GM into the world’s largest automaker also became its liability. Consumers increasingly found GM’s business model of offering basically the same vehicle across each division, a turn-off. The sales started reflecting this dissatisfaction.

For example, one reason why Pontiac got the ax, is because it was essentially Chevrolet with sportier packaging. Oldsmobile was too much like Buick but less luxurious, but more so than Pontiac. GMC is basically an upscale Chevy truck, van, and SUV brand, and Buick is essentially a ‘near-luxury’ brand similar to Chevy ‘with Cadillac aspirations’. So, my proposal to kill off Buick and GMC isn’t too far-fetched. If GM could ax Pontiac, a brand that many consumers were passionate about, and one that sold relatively well, General Motors could certainly kill off GMC and Buick.

Unequal Development: How Does North and South Decatur Differ?

‘We Full’

No matter where you go in metro Atlanta, you’ll see signs of a fast-growing metro area: worsening traffic, new construction, and schools bursting at the seams. Many Atlantans share a meme with bad traffic and the caption “We Full”. Indeed, the city of Atlanta and the surrounding metro area is growing to the tune of 75,000 plus new residents between 2017 and 2018 according to the most recent Census estimates. Since the last official census to 2010, metro Atlanta has added 663,201 people, or like adding the city of Nashville to the metro area.

There’s an area of metro Atlanta with the perfect ingredients for growth like everywhere else. It’s close to the airport, has easy interstate access, it’s close to downtown, midtown, and the rapidly growing intown neighborhoods on the eastside, and has a variety of housing, much of which is affordable. This area is seeing an influx of new residents, but new development is virtually nonexistent. This area is south DeKalb.  

History of an Area: 1960s – 1990s

It hasn’t always been this way for south DeKalb. The area grew fast between the late 60s through the late nineties. As the once largely rural area became more suburban, black residents came in and white residents left – and as white flight goes, businesses and jobs left. Even with all the new housing developments built over the past four decades, the area is still the most undeveloped part of DeKalb County.

As south DeKalb added more residents and lost more chain and choice retail stores, DeKalb County welcomed more businesses – mostly in north DeKalb. The northern end of the county soon got cityhood fever with Dunwoody, Brookhaven, and Tucker staking their respective territories. The area around Perimeter Mall (Dunwoody) and Brookhaven added more shopping, big hotels, and high-rise office buildings. The area around I-20 east and I-285, Panola and Wesley Chapel added more dollar stores, fast food restaurants, and cheap motels.  

Long-time south DeKalb residents met with their county commissioners to demand more development and better choices. They’d get the Mall at Stonecrest and the surrounding explosion of retail centers, restaurants, and big-box stores in the early 2000s and jewels like the Sanford Porter Performing Arts Center. But they also wanted to eat out at a nice restaurant close to home or take the family out for entertainment for something other than the movies (which also saw a decline in the number of theaters).

South DeKalb is no Slacker

In the article, Why it’s Time for Change in Southern DeKalb County, some surprising findings were uncovered about south DeKalb. It noted that despite having major roads with high traffic counts, a large population, and median household incomes similar to several metro Atlanta cities, certain retailers and restaurants seem to shun the area.

As Dunwoody and Brookhaven started getting more selective in which types of development they wanted, putting up their respective ‘we full’ signs, developers soon fell in love with north Decatur. This area, centered around North Decatur Road, Scott Boulevard, and Church Street, is the home of two new shopping centers, Emory Decatur Hospital, and is less than a 10-minute drive from Emory University and the CDC.

Residents of south DeKalb yearned for more upscale housing, aesthetically pleasing roadways and businesses, healthier grocery and restaurant options. Residents of north DeKalb welcomed not one, but two health food stores, millennial-attracting housing, spruced up roadways and businesses, and a multitude of fast-casual and upscale restaurants. The Gallery at South Dekalb, AKA South DeKalb Mall, can’t keep a movie theater while North Dekalb Mall, which has a fraction of the business the Gallery at South DeKalb has, has a thriving multiplex theater.

How Does North and South Decatur Differ?

These observations powered my questions about the differences between north and south Decatur, reflecting the omission of the cities of Stonecrest, Lithonia, Dunwoody, Brookhaven, Tucker, Chamblee, and Doraville from this conversation. I included the city of Decatur in the north Decatur data (which could have been split north and south to go with the respective north and south Decatur demographics). Zip code 30317, split north-south by Memorial Drive and bordered on the south by Glenwood Road, was included with south Decatur’s data.

The population difference between the two areas is stark: south Decatur has a little more than 126,000 residents, while north Decatur has a little more than 67,000. Racial demographics are even more lopsided: There are six times more white residents in north Decatur (almost 66%, versus less than 11% in south Decatur) and four and a half times more black residents in south Decatur (85.5% vs 18.9% in north Decatur). The median age is a little older in south Decatur (36 years, compared to north Decatur, 35.75 years). The median home value in south Decatur is a little more than half that of north Decatur ($124,400 vs $245,750). Median household incomes between the north and south are $53,578 and $45,033 respectively, a difference of $8,545.

Population Comparison Between North and South Decatur

Data source: Moving.com


Percentage of Racial/Ethnic Groups in South and North Decatur

Data source: Moving.com


Median House Values – South and North Decatur

Data source: Moving.com


Median Household Income – South and North Decatur

Data source: Moving.com

However, it also has a big minus – generic cialis tadalafil a high price. Such type of pharmacies are to levitra online order be avoided by women as they are specifically meant for men with ED. The medicine is available in the tablets and order cialis online jelly form. As you viagra italy can see, ladies abandoned allegation a little accession with their beastly action and Provestra is adequate for that.

Nearly half of north Decatur residents are married while a little more than a third of south Decatur residents are married (49.8% vs 34.4%) and 51.5% of the homes are owned compared to 47.12% of homes owned in south Decatur. A higher percentage of north Decatur homes are rented than in south Decatur (38.3% vs 35.98%). There are 6.7% more vacant homes in south Decatur than in north Decatur (16.9% vs 10.2%).


Percentage of Married Population – South and North Decatur

Data source: Moving.com


Percentage of Homes Owned – South and North Decatur

Data source: Moving.com


Percentage of Homes Rented – South and North Decatur

Data source: Moving.com


Percentage of Homes Vacant – South and North Decatur

Data source: Moving.com


Is this Why North Decatur Get All the Good Stuff?

The takeaways are north Decatur might be seeing more development because of its proximity to major employment centers of Emory University, CDC, Emory Decatur Hospital, and all the ancillary organizations. This area is more racially diverse, has a higher median household income, the residents are married at a higher percentage, and more homes are owned and there are almost 7% fewer vacant houses in north Decatur. The last three metrics are just some important factors retailers consider when opening a new location, which suggests a long-term commitment to a community with ‘most likely’ scenarios such as starting a family, staying in the area longer, and less blight from vacant homes. The median age differences in both areas are negligible.


How Diverse is South Decatur?

Data source: Moving.com


How Diverse is North Decatur?

Data source: Moving.com


What if All Auto Brands were Made in the Same Factory?

In the past decade, we’ve seen the death of General Motors divisions Oldsmobile and Pontiac, Chrysler’s division, Plymouth and Ford’s Mercury. Within those brands were iconic cars such as the Cutlass Supreme, Firebird, and Barracuda. In a world where auto sales are falling, demand for transportation is increasing. All opinion-makers want to blame Millennials for ‘killing’ yet another industry, I believe the automotive industry has not adapted to the changing world as much as it should have. Millennials are a generation that votes with their wallets. If it doesn’t make sense to do, they won’t do it.

People love cars, even the process of buying a car has improved immensely as dealerships have adapted quite nicely to the digital age and buying habits, but owning a car have become too cost-wieldy for younger consumers. When adding in insurance, fuel, and maintenance costs, it doesn’t make sense for a generation with heavy student loan debt to purchase a car that they’ll only need 5% of the time. This brings to light something Bill Gates said at Comdex years ago: “If GM had kept up with technology like the computer industry has, we would all be driving twenty-five dollar cars that got 1,000 miles per gallon.”

What wasn’t said in response to Bill Gates’ comment, but was made into a joke was “Yes, but would you want your car to crash twice a day?”

The joke goes further. We’d have to deal with the following if Microsoft built cars:

  • Every time they repainted the lines on the road you would have to buy a new car.
  • Occasionally your car would die on the freeway for no reason, and you would just accept this, restart and drive on.
  • Occasionally, executing a maneuver would cause your car to stop and fail and you would have to re-install the engine. For some strange reason, you would accept this too.
  • You could only have one person in the car at a time unless you bought Car95 or CarNT. But then you would have to buy more seats.
  • Apple would make a car that was powered by the sun, was reliable, five times as fast, twice as easy to drive – but would only run on 5 percent of the roads.
  • The Apple car owners would get expensive Microsoft upgrades to their cars, which would make their cars run much slower.
  • The oil, gas and alternator warning lights would be replaced by a single “general car default” warning light.
  • New seats would force everyone to have the same size butt.
  • The airbag system would say “Are you sure?” before going off.
  • If you were involved in a crash, you would have no idea what happened.
Visit to order levitra you regular medical practitioner annually for complete body check ups. Men can use both of these buy levitra in canada herbal supplements to cure ED and PE naturally and enjoy intimate moments with their females. Since ED is cause by psychological factors too, extensive counseling and meditation can help to overcome this issue or unica-web.com viagra online consultation it can just take over with your health issues or in the process of getting cured. This in time can lead to an buy viagra without rx increased risk for developing it.

Ride-Sharing and Consolidation in the Auto Industry

Lyft and Uber recently had highly anticipated IPOs and although their share prices fell below initial expectations, don’t think these platforms are going away. There are millions of riders across the globe who depend on these ride-sharing companies. It’s only a matter of time when Lyft and Uber and the smaller platforms work out the pesky details of contractor vs employee and how to be profitable and not lose customers. Auto manufacturing companies, in the meantime, continue to be under pressure amid falling sales. As of this writing, Fiat Chrysler Automobiles is seeking to merge with France’s Renault, which would make it into the third-largest automotive manufacturing company in the world after Volkswagen, and Toyota.

Some are calling this a ‘move of desperation’, I differ to think that. I believe it’s a move to first bolster bottom lines, then be able to take advantage of economies of scale, and thereby, save money. The money saved could then be used in electric and autonomous vehicle research. In this coming world, auto dealerships could adapt to become less brand-centric and more of a transportation provider portal. This would not be much different from how retail stores operate. Target or Walmart carries a variety of brands and items which are mostly differentiated by pricing.

Auto manufacturers have a long history of collaboration and this would most likely continue. With many trends coming together in the automotive industry, we may something even more game-changing than mere collaboration and merging. What about a new manufacturing platform that would utilize more 3-D printing, one in which all brands would have access to build their vehicles. Also, automotive manufacturers might build cars using a standardized chassis. A brand would simply attach its car body to the chassis. This could especially work with electric vehicles. Manufacturers could defray costs by teaming up with third-party chassis builders, and they could focus strictly on the car body design, features, and options. This would streamline the manufacturing process and spread costs among all brands. Brands would still have the ability to customize their specific options and trims to their particular offerings.

I am no automotive manufacturer. This is just an idea. I am sure an automotive factory designer could bring up a multitude of reasons why this might not be viable or the intricate processes of manufacturing vehicles can’t be adapted to this model.

This is Love and Marriage in America Today

The institution of marriage predates recorded history and has changed much throughout its history. The love, sex, monogamy, and attraction components were not as much a part of marriage until much later. Starting as a way to strengthen family social and business bonds to slowly integrating the familiar attributes we associate with marriage today, the ‘I dos’ are changing over to ‘maybe we will’ or ‘maybe we won’t’.

Why do People Marry?

Love is the top reason to marry, according to a 2013 survey by Pew Research. With 88% of the survey responders saying love was the reason they wanted to get married, then making a lifelong commitment (81%), companionship (76%). Having their relationship recognized in a religious ceremony was far down on the list (30%), financial stability (28%) and less than a quarter percentage (23%) cited legal rights and benefits as a reason for getting married.

A 2017 Pew Research survey found that being a good financial provider was deemed important for men to be a good husband or partner (71%), while only 32% said the same thing for a woman to be a good wife or partner.

What helps people stay married? A 2015 survey said having shared interests (64%), a good sexual relationship (61%) and when a husband or wife helps share the household chores (56%).

Who’s Married?

Forty-Eight percent of Americans age fifteen plus were married in 2017. The age group with the lowest percentage of married members is ages 20-34 (Millennials – 27.1%) and the age group that said ‘I do’ the most were 55-64-year-olds (67.3%). In 2017, the marriage breakdown by race is as follows: Blacks married at 29.3%, Whites, 52.7%, Native Americans, 36.7%, Native Hawaiian and other Pacific Islanders, 45.4% and Asians were married at the highest percentage at 58.2%.   

Men desire to make sex, but he is unable even there is check that web-site order levitra online all positive atmosphere for him. During that time, liver bile is levitra discount prices redirected to the gallbladder. Other studies suggest that almost all prices viagra men experience occasional erection failure. There are a lot of companies are stretching their hands to produce this kind of on line viagra deeprootsmag.org.

Data from U.S. Census Bureau

Men were married at 58% (73.573M) compared to 69.899M women married (52.5%). Four percent more men have never married than women (25.5% vs 21.5%).

Data from U.S. Census Bureau

Data from U.S. Census Bureau

Marriage Evolves

According to a Pew Research Center analysis, interracial marriage is on the rise. In 2015 17% of newlyweds chose someone from a different race or ethnicity. This is up nearly six times from 1967 when just 3% of newlyweds did the same.

Source: Pew Research Center

Asian and Hispanic newlyweds are most likely to intermarry (a respective 29% and 27%) in the U.S., but the biggest increase in the number of newlyweds intermarrying was among blacks. In 1980, only 5% of black newlyweds married someone of a different race or ethnicity. In 2015, more than three times as many blacks (18%) intermarried. According to a 2019 Pew Center report, the generations had widely differing opinions about whether intermarrying was good for society. Among Gen Z and Millennials, 53% say intermarrying was good, and 41% of Gen Xers said so. As generation members got older, they opined that intermarrying was not good for society: Boomers (30%) and the Silent Generation (20%).

Source: Pew Research Center

In the last decade, Americans have increasingly supported the legalization of same-sex marriage. In 2007, Americans opposed legalizing same-sex marriage 54%, while 37% supported it. By 2017, the numbers flipped to 32% opposed and 62% supporting it. A Gallup survey found that 10% of LGBT Americans were married in 2017. Now, 61% of all same-sex couples living together are married.

In a 2019 Pew Research Center report, nearly half of Gen Z and Millennials (respectively 48% and 47%) say same-sex marriage is good for society, while Gen Xers (33%), Boomers (27%) and Silent Gens (18%) say the same thing.

Source: Pew Research Center

Marriage and Divorce Rates Fall

The U.S. marriage rate declined from 8.2 marriages per 1,000 people in 2000 to 6.9 marriages in 2017 a nearly 15.9% decline. Something to note is the steep drop in the marriage rate from 2008 to 2009, corresponding to the start of the Great Recession. Home price bubbles burst and the housing crisis shifted into higher gears to set off the recession, people simply decided that it was better to put off getting married. The divorce rate has also declined during the same period, from 4 divorces per 1,000 people (48.78% of the marriage rate) in 2000 to 2.9 in 2017 (42.02% of the marriage rate). Divorces declined 27.5% from 2000-2017, nearly double the marriage percentage decline during the same period.

Marriage and divorce rates are falling as another relationship dynamic is rising.

Cohabitation

In 2016, 18 million Americans were living with an unmarried partner, this is an increase of 29% in less than a decade. About half cohabiters are younger than 35, but cohabitation is finding more fans in the age 50 and older category. This age group is cohabitating more quickly than other groups (75% jump).

Living Arrangements of Adults Ages 18-24

Living Arrangements of Adults Ages 25-34

Source: U.S. Census Bureau

Who are Cohabitating?

Credit: Pew Research Center

According to a 2019 Pew Research Center, cohabitation is more favorable among Gen Zers, Millennials, Gen Xers and Boomers, where large majorities of these members don’t feel that living together without being married doesn’t make a difference in our society. Even 54% of the Silent Gen is down with cohabitation, but 41% of the members in this generation say cohabitation is a bad thing.

Cohabitation has been considered bad for a successful marriage since the 1970s. Researchers found on average that couples who cohabitated before they married saw a 33% higher divorce rate than those couples who did not cohabitate before marriage. This may be due to a couple not thinking too deeply about making a conscious decision to share an entire life together. In other words, it was more convenient to ‘slide into’ marriage than to break off the relationship. When ‘real-life’ hits, the seriousness of ‘till death do us part’ is secondary as the couple may have looked at marriage not too different from getting a dog or buying a car together.  

Religion, Political Affiliation and Marriage

There are large minorities of married couples that do not share the same religious belief. Among Americans who have been married since 2010, 39% have a spouse in a different religious group. This is 20 percentage points higher than those who wed before 1960. Most of these unions are between a Christian and a religiously unaffiliated spouse.

Politics divide more than religion. A 2016 Pew Research Center survey found that 77% of both Democrats and Republicans who were married, or cohabitating said their spouse or partner was in the same political party.

The takeaways are:

  • Most people marry for love, lifelong commitment, and companionship, while the other traditional reasons for marriage: having their relationship recognized in a religious ceremony, financial stability and legal rights and benefits are way down on the list of why couples get married.
  • Attitudes among Gen Z, Millennials are generally more positive towards interracial marriage, while it is less favorable among Gen Xers and older.
  • Attitudes about the legalization of same-sex marriage have flipped towards more acceptance between 2007 and 2017.
  • People are more aligned by political party affiliation than religion and choose their significant others based on this.
  • Divorce attorneys might be getting a little worried about the number of people choosing to get married (and subsequently those getting a divorce).
  • We are increasingly becoming a product and service subscription-based society where long-term commitment is not a guarantee as much. Marriage from the beginning was predicated on ownership. The wife was literally obtained as part of a trade: land, livestock, favorable business relationships with the family.
  • Younger generations eschew ownership and long commitment. This might have affected the way they look at marriage. Opting to choose relationships and living arrangements that do not have the ‘ownership’ and ‘forever commitment’ constraints. We can call this the Spotifyzation of relationships.

Sources:

8 facts about love and marriage in America

U.S. Census Bureau

Led by Baby Boomers, divorce rates climb for America’s 50+ population

Number of U.S. adults cohabiting with a partner continues to rise, especially among those 50 and older

Living Arrangements

Marriages and Divorces

When To Walk Away From Sexless Marriage (Truth Revealed)

History of Marriage:13 Surprising Facts

Marriage in Black America

Marriage and divorce: patterns by gender, race, and educational attainment

The Science of Cohabitation: A Step Toward Marriage, Not a Rebellion